
dJoule
DSI submitted the final model and report for use in management scenario analysis.
The Lake Washington Ship Canal (LWSC) is a man-made waterway that connects Puget Sound at Shilshole Bay to Lake Washington at Union Bay through Salmon Bay, Lake Union, and Portage Bay. This U.S. Government project was completed in 1916 with the construction of the Ballard Locks, Fremont Cut, and Montlake Cut. It lowered Lake Washington by 9 feet and dried up the Black River at the south end of the lake, changing the migration path for salmon in the watershed that used to number 650,000 in a typical year. DSI developed a three-year calibrated 3D hydrodynamic model of Lake Washington, including the Lake Washington Ship Canal (LWSC), and enhanced it through prior project work with LLTK in 2023.
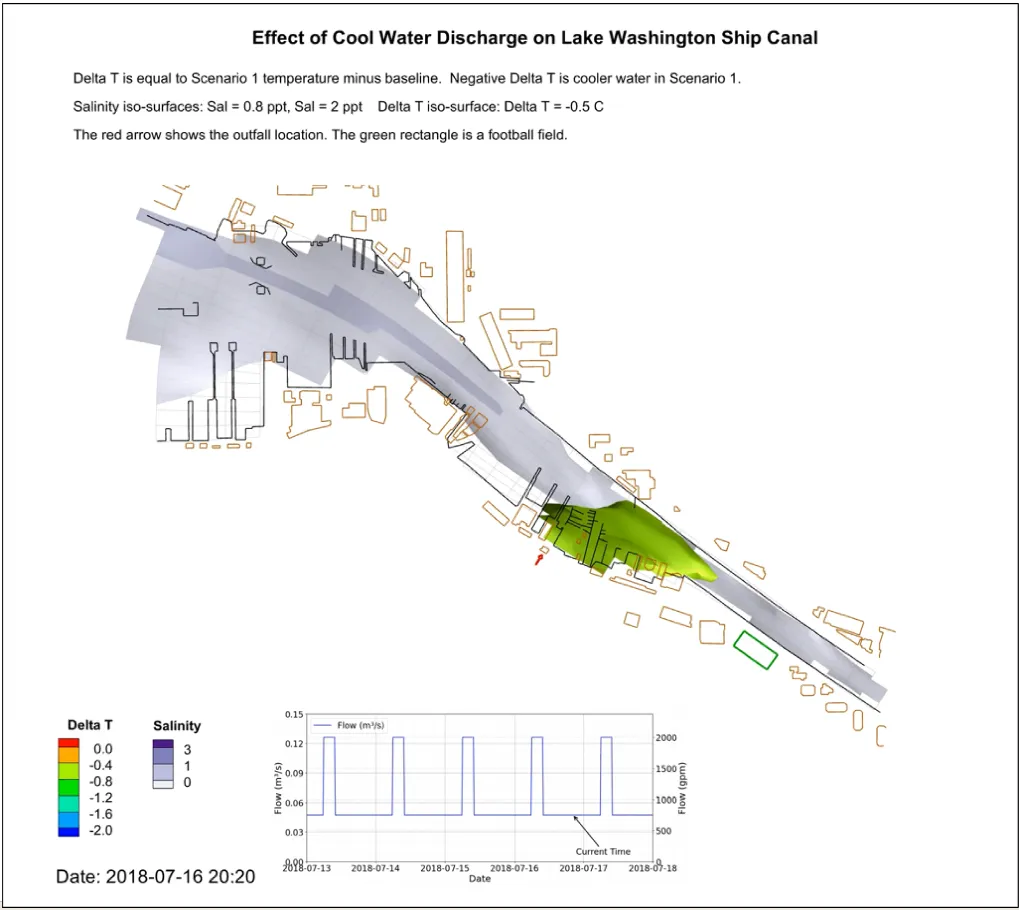
Building on prior Lake Washington modeling, this study applied an existing 3D EFDC+ Lake Washington Ship Canal model to simulate and visualize a localized cold-water patch generated by discharging approximately 3 cfs (1,350 gpm) of 48°F groundwater. The analysis evaluated the patch’s size, persistence, and trajectory relative to the salt wedge to assess its potential to influence salmon movement and provide thermal refuge, and produced decision-support graphics for engineering planning and outreach.
The three-year calibrated EFDC+ hydrodynamic and salinity model of the Lake Washington Ship Canal was applied to simulate the formation and behavior of a localized cool-water patch. Year 2018 was selected as the base model. For scenario testing, a continuous baseline discharge of 750 gpm was maintained throughout the simulation to represent minimum operational flow. From July 13–17, daily 4-hour morning pulses increased discharge by an additional 1,250 gpm using 300,000 gallons of stored water, followed by a 250 gpm supplemental flow for 20 hours to refill storage before returning to the baseline condition. Model outputs were analyzed using time series, horizontal, vertical, and longitudinal profiles, along with animations to evaluate plume extent, duration, and transport. In a second phase, Tecplot 360 was used to generate 3D visualizations of the cold-water patch and to quantify the affected water volume for temperature reductions of 0.9°F, 1.8°F, and 3.6°F relative to baseline conditions over the five-day pulse period. Simulations indicate that targeted releases can achieve measurable temperature reductions.
The final model results and 3D animations were submitted to the client to be used in developing and evaluating additional management scenarios.