
Authors: Mehrzad Shahidzadehasadi, Thomas J Mathis, Nguyen T K Linh,
Bui Minh Hoa, Wei-Cheng Wu, Tran Duc Kien, Paul M Craig
Dates: November 5-8, 2024
Location: South Lake Tahoe, CA/NV
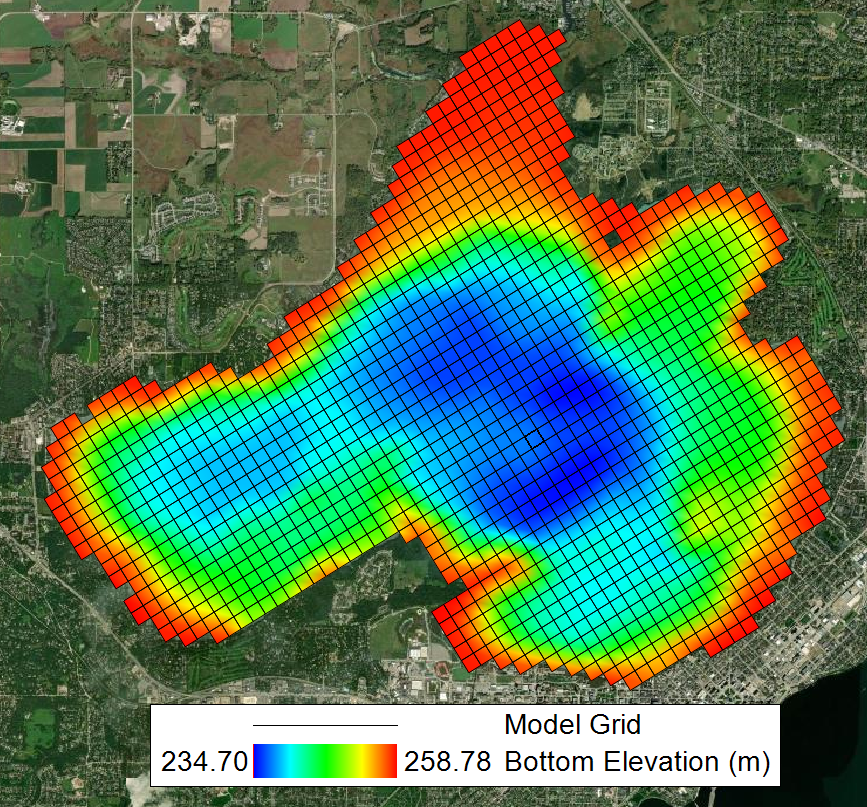
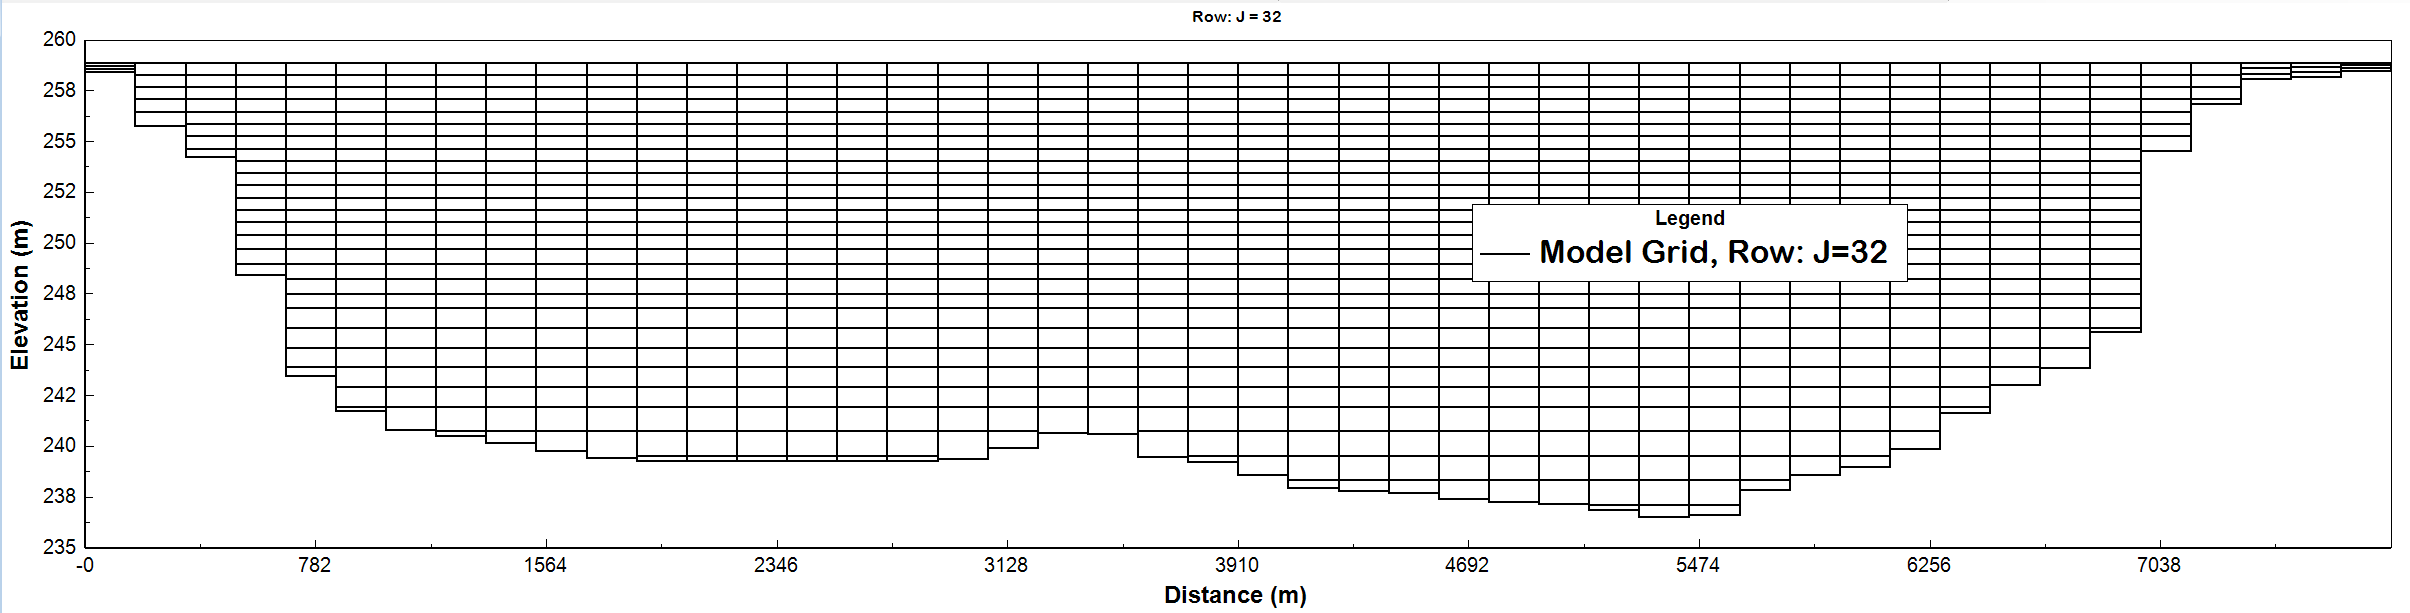
This study conducts a sensitivity analysis and calibration of a three-dimensional water quality model for Lake Mendota, a eutrophic lake in Madison, Wisconsin, using EFDC+ software. Figure 1 shows the bathymetry and grid structure used in the simulation. The model consists of 1405 grid cells horizontally and the vertical layering option (Figure 2) used is sigma-zed uniform layers with 3-30 layers based on the depth which their thicknesses range from 0.025 m near the surface to 0.05 m close to the bottom of the lake.

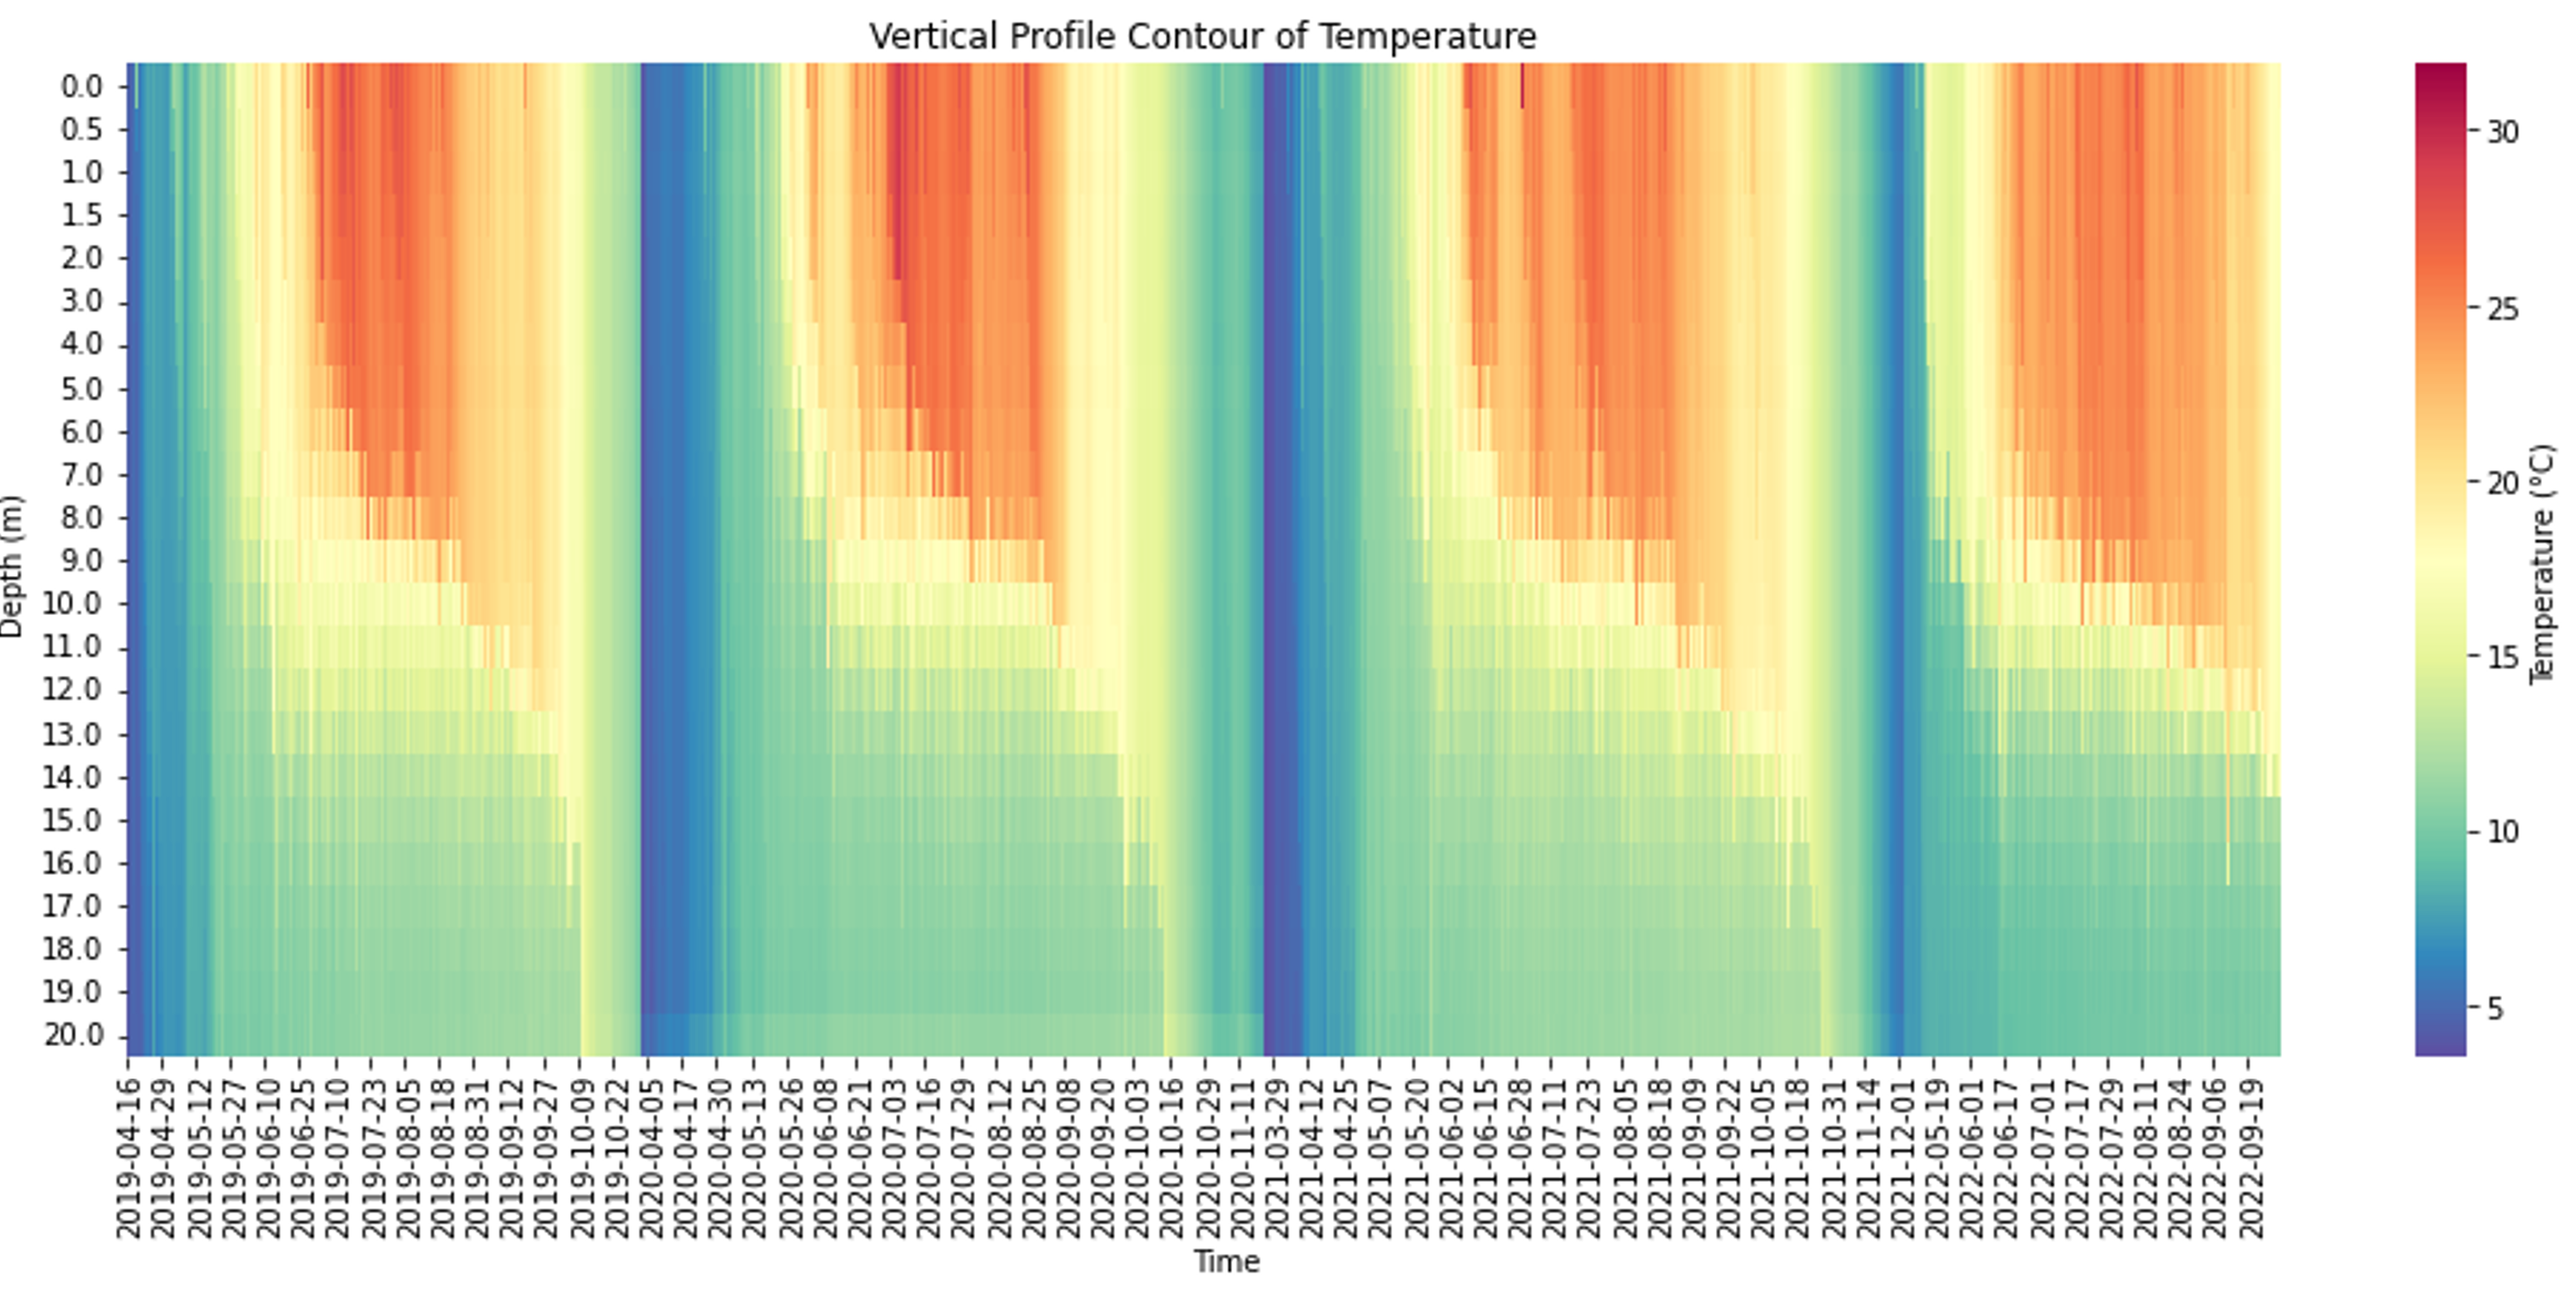
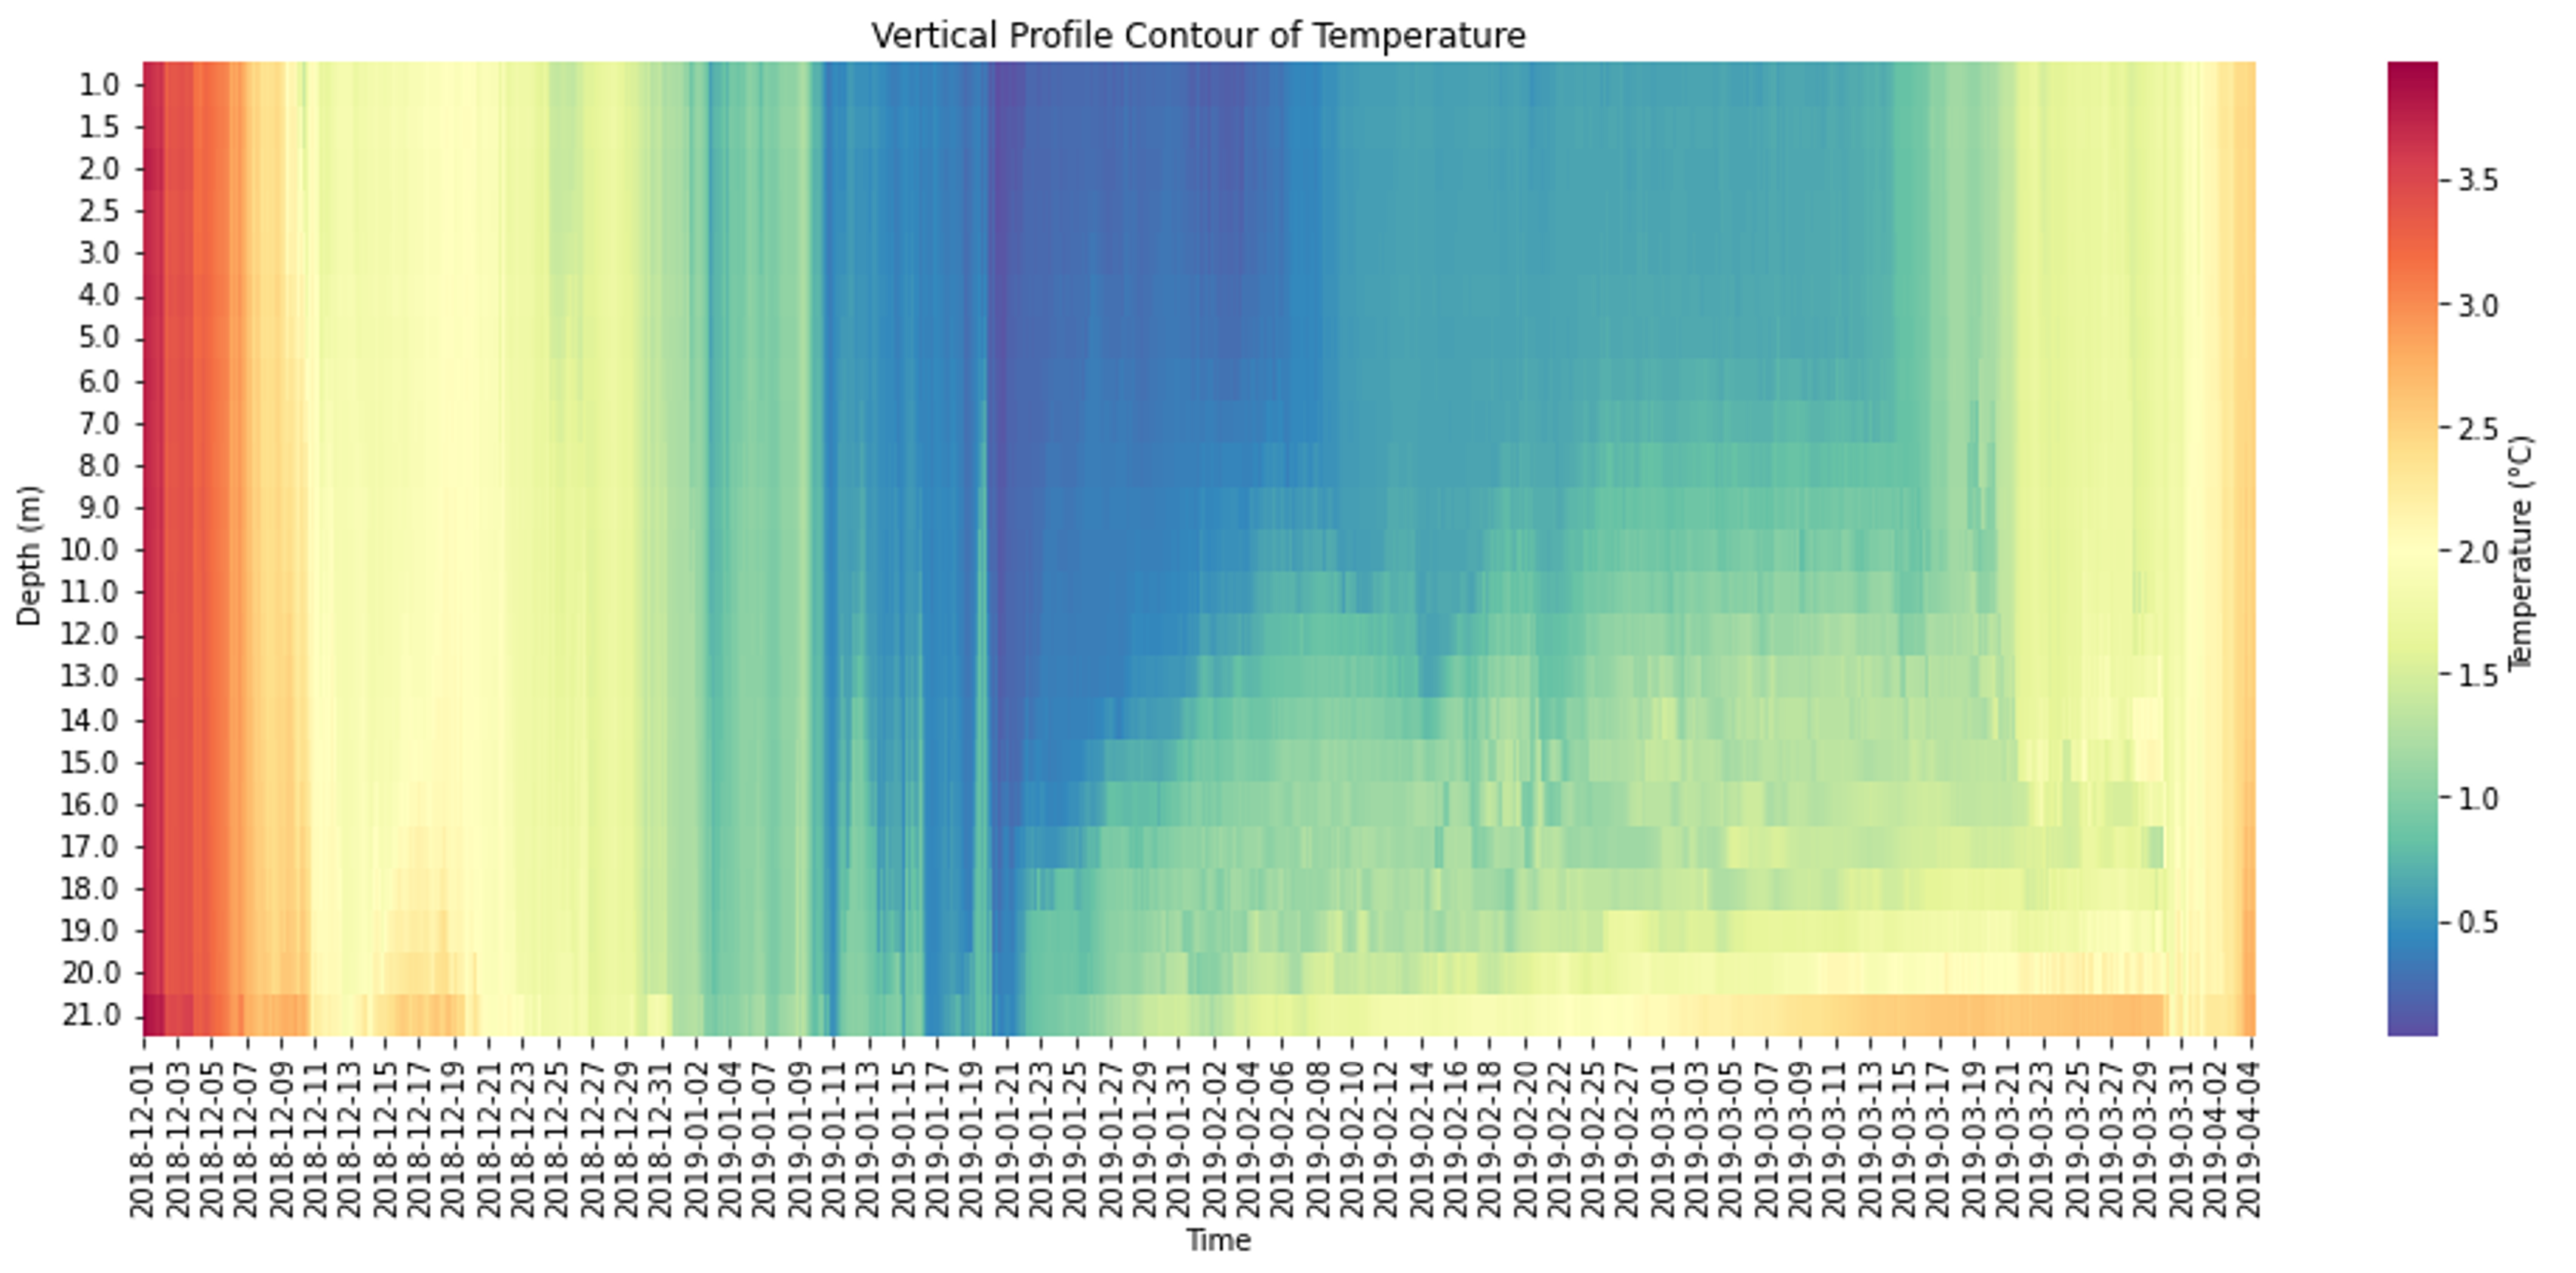
Lake Mendota exhibits distinct seasonal stratification patterns, with summer stratification and winter inverse stratification under ice. The temperature vertical profile contours for summer stratification and under ice inverse stratification are respectively generated from a minutely temperature dataset at the buoy location and an hourly measured under ice temperature dataset shown in figures 3 and 4. The calibration and sensitivity analysis were conducted by three datasets:
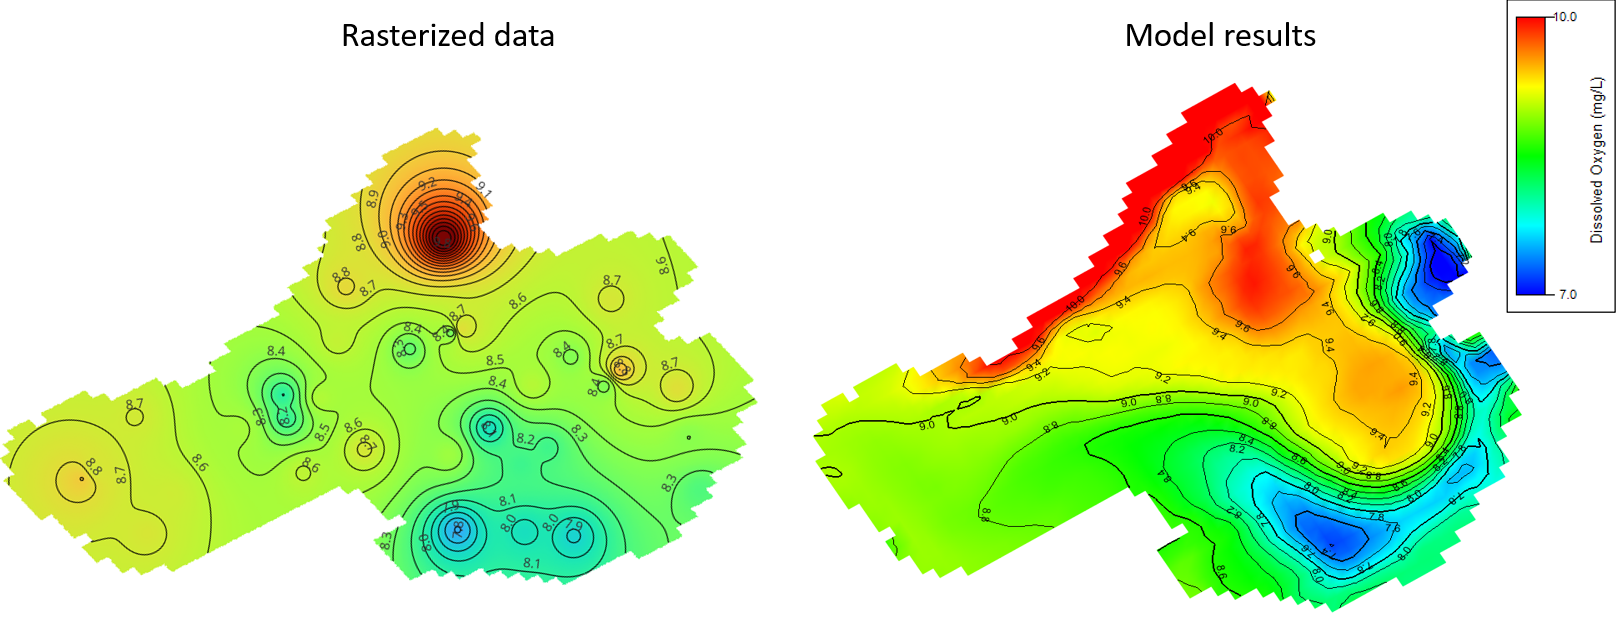
The first dataset provided spatially distributed surface sonde measurements from 35 randomized grid points across four summer seasons, the mean location of the grid cells is shown in figure 4 offering insights into spatial variability and helping evaluate the model's sensitivity in different parts of the lake. Different parameters in this dataset are interpolated and rasterized, then compared to model results at that date/time, an example of DO comparison is shown in figure 5.

The second dataset contained depth profiles from 0 to 20 meters, capturing water temperature, dissolved oxygen and water quality parameters. This dataset helped in assessing the model's ability to accurately represent lake stratification and vertical gradients. Animation below shows the vertical profile of Temperature, DO and Chl-a from this dataset.
The third dataset offered measurements from an instrumented buoy located in a deep part of the lake, supplying monthly water quality data. This dataset was key to understanding the lake's dynamics over time, allowing for a thorough examination of the model's temporal accuracy. The data are used both in the shape of time series at different depths and vertical profiles for model vs measured comparisons.
A variety of parameters listed in table 1 were examined to understand their impact on the model's accuracy, with particular attention to algal kinetics, sediment diagenesis, and light attenuation. The sensitivity analysis identified that the highlighted parameters in the table below, most of which related to phytoplankton growth and sediment fluxes are essential to the model's performance.
| Parameter | Unit |
|---|---|
| Nutrient sediment fluxes (when constant fluxes option is used) | g/m²day |
| Sediment thickness (when sediment diagenesis option is used) | m |
| Diffusion coefficient in porewater (when sediment diagenesis option is used) | m²/d |
| Sediment burial rate (when sediment diagenesis option is used) | cm/year |
| Nitrification half-saturation constant for DO | gO₂/m³ |
| Oxygen consumption due to respiration | gO₂/m³ |
| Phosphorus half-saturation for cyanobacteria/diatom | mg/l |
| Nitrogen half-saturation for cyanobacteria/diatom | mg/l |
| Maximum basal metabolism rate for cyanobacteria/Diatom | 1/day |
| Minimum Hydrolysis Rate of RPON and LPON | 1/day |
| Minimum Heterotrophic Mineralization Rate of DOC | 1/day |
| Maximum growth rate for Cyanobacteria/Diatom | 1/day |
| Minimum concentration for Cyanobacteria/Diatom | gC/m³ |
| Fraction of carbon produced as LPOC RPOC and DOC due to predation | - |
| Fraction of phosphorous produced as LPOP RPOP DOP and PO4 due to predation | - |
| Background light extinction coefficient | 1/m |
References
knb-lter-ntl.428.1 Data Portal - Data Package Summary | Environmental Data Initiative (EDI) (edirepository.org)
knb-lter-ntl.400.4 Data Portal - Data Package Summary | Environmental Data Initiative (EDI) (edirepository.org)
knb-lter-ntl.1.60 Data Portal - Data Package Summary | Environmental Data Initiative (EDI) (edirepository.org)
knb-lter-ntl.130.32 Data Portal - Data Package Summary | Environmental Data Initiative (EDI) (edirepository.org)
knb-lter-ntl.390.3 Data Portal - Data Package Summary | Environmental Data Initiative (EDI) (edirepository.org)
Let us know if you have questions or interest in this topic. We hope to see you at the conference.